Create a constructor for ggplot for lines, points, etc.
Usage
scale_color_statworx(
  palette = "statworx_standards_1",
  discrete = TRUE,
  reverse = FALSE,
  col_list = c(),
  ...
)
Arguments
- palette
A color palette.
- discrete
If true, discrete palette is returned. Otherwise, continuous palette.
- reverse
If true, order of palette is reversed.
- col_list
Provide a vector of colors if parameter palette="custom".
- ...
arguments passed to
discrete_scale
Examples
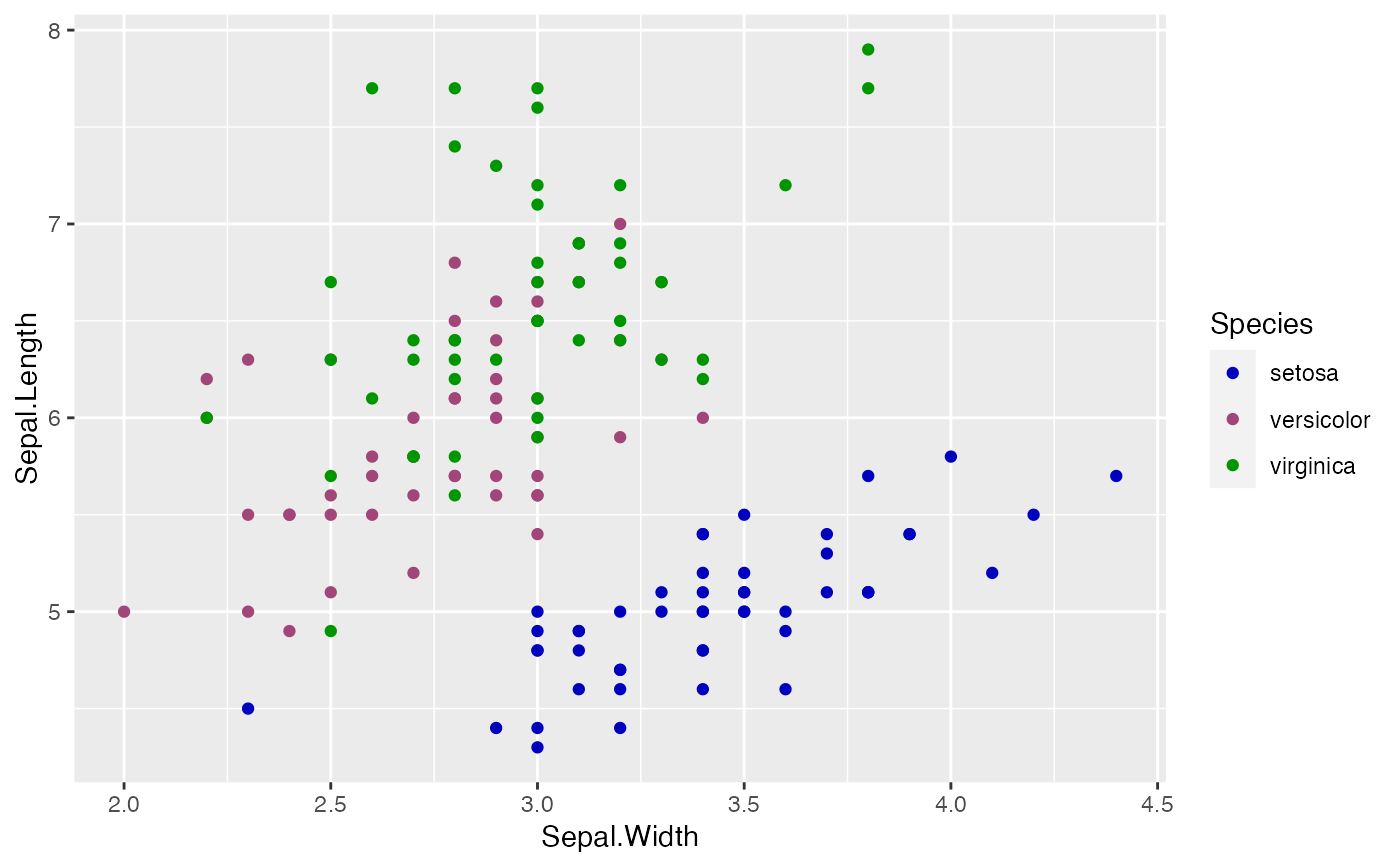
ggplot(iris, aes(Sepal.Width, Sepal.Length, color = Species)) +
geom_point() + scale_color_statworx()